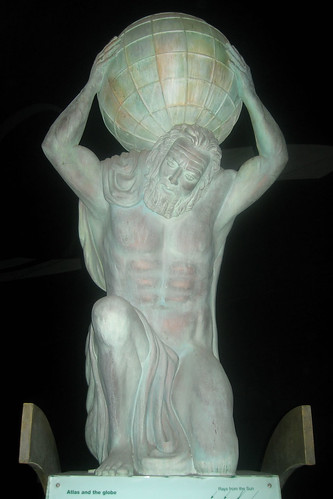
I've run a few laps already with Atlas.ti, using it to code data for two small projects within the past year. Yet, even I was mentally and physically wasted after last night's workout.
Maybe "triathlon" is a better way to describe what it's like to work in the flexible and multifaceted environment of Atlas.ti. Konopasek (2008) referred to the "sophisticated interface" of CAQDAS tools in general and then specifically described Atlas.ti's "visualisation" capabilities, in which the researcher's "thoughts or mental operations can easily be stored, recollected, classified, linked, filtered out in great numbers...and made meaningful in sum."
 |
| Some rights reserved by hmcotterill |
Something else strikes me as powerful about Atlas.ti and the other digital tools we are exploring. Again and again in the EP604 course readings, I've noticed the suggestion that technology is blurring the lines between the strict, paradigmatic camps -- quantitative vs. qualitative, positivist vs. constructivist.
Seale (2010) tells us that the "counting" capabilities of CAQDAS software "is a reminder that the days of a great divide between qualitative and quantitative research work have now largely passed" (p. 255). And I am intrigued by Konopasek's comparison of Atlas.ti to a "textual laboratory." The metaphor literally co-opts the venue most commonly associated with scientific and positivist inquiry.
I am no statistician, but I like the way Atlas.ti enables the qualitative researcher to perform quantitative functions such as frequency counts and the "Word Cruncher," not as an end-all-be-all of analysis, but as a jumping off point for deeper exploration of connections, patterns, and new meanings.
For example, the first time I used the software, I ran a frequency count for a particular phrase in my transcripts just to confirm a hunch before I started coding. I realize I could have used the "find" and "comment" tools in MSWord to perform these simple operations, but it was what I was able to do after coding that sets Atlas.ti apart from a word processor. I began looking for the co-occurrence of three specific a priori codes based on the TPACK framework (technology, pedagogy, and content). Turns out, that didn't happen much in my transcripts, but Atlas.ti did help me to see more than twenty intersections between the "technology" and "pedagogy" codes. This sent me down an altogether different and fruitful path of inquiry.
These previous experiences with Atlas.ti are the equivalent to running sprints. Now, after having received some guided, hands-on instruction, I have a clearer vision of how Atlas.ti. can function as an all-inclusive research notebook, containing fieldnotes, comments, memos, codes, and a seeming infinite variety of visual, textual, and statistical outputs generated by the researcher. I am ready to go the distance.

Okayy, so I never put together where the name Atlas came from. Excellent insight - even the icon didn't clue me in. Oh well.
ReplyDeleteI also noted some of Searle's claims about the distinction b/w qual and quant going away. I'm not sure I agree, but I do think there's enough truth to his observations that it makes qualitative researchers nervous - and that's part of what I want to write about/explore in our book on technology-supported qualitative research.